(This will be a very transparent post but will be useful for the next post involved in extracting this mentioned number of prob of success)
As amateur astronomers, we all share the problem of unwanted "nebulosities" in the sky, yes I'm talking about clouds. Well, actually, if you live in a truly light pollution-free environment, then maybe it's an unwanted bok globule.
Even worse, if you want to introduce and share your passion with others, you will find these others quickly dissuaded by your failed attempts to show them the night sky because a combination of these unwanted objects and Murphy's law.
This is where statistics comes in. First let's introduce the problem and see how it is related to a simple probability distribution.
Binomial Distribution
Let's say you have observed over a few years that in the month of January, it is cloudy 2/3rds of the time. If you organize an astronomical event, you have a 1/3rd (33%) chance of success.
Rain Date
That's difficult because most likely you'll fail. How do you improve the odds? Let's say you choose a rain date. Your chance of success is now:
(chance of success 1st day) + (chance of failure first day) *(chance of success second day) = 1/3 + 2/3*1/3=55%
You have almost doubled your chance but not quite. What about a 2nd rain date?
Chance success = 1/3 + 2/3*1/2 + 2/3^2 *1/3 = 70%. Your chances are increasing in diminishing returns.
The importance here is that by doubling your dates, you haven't doubled your chances. It's obvious, but we need to formalize it for the next step.
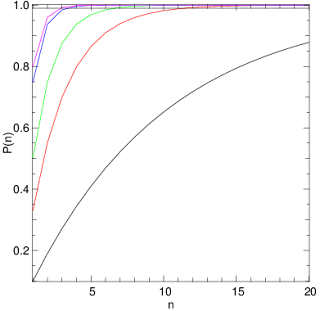 |
| Probability of success for n-1 rain dates where perecentage success for one day is 10% (black), 33% (red), 50%(green), 75%(blue) and 80%(magenta). The horizontal black line is 99% chance of success. |
So let's calculate this for multiple rain dates. The calculation is done here for n-1 rain dates above for probability of success 1/3 (red curve). The flat black line at the top of the curve is the chance of 99% success. We see that for region with 33% chance of no cloudiness, we would have to schedule 9 rain dates (total of 10 days) to beat Murphy's law with a chance of success! You see that even with 50% success you need 6 rain dates to achieve this confidence! And you can forget about it if your chance of clear skies is 10%.
What does this all mean? Basically, if you're an amateur astronomy club in a region where the chance of clear skies is 50% or lower, you'll have to think a little carefully before planning an event.
side note
I would like to note that this is an extreme simplification of the problem and that two things are important:
1. The cloudiness on dates chosen are independent of one another. If they're dependent, this just worsens your chances.
2. This prob of success p will probably vary month to month. The easiest simplification to this is assume the change is not large and base your calculations on the worst of the chances.
The solution
Basically, the solution to this problem (a depressing one) as an astronomy club organizer is to make sure to hold at least the number of events throughout the year that would guarantee you one event with a 99% chance of success... Holding 10 rain dates (in Montreal, where we believed the success prob to be at worst 33% for any given month) isn't really popular for any club. It's best just to hold 10 separate events throughout the year.
If you're doing this for your friends, well at least now you have a chance of warning them what they're getting into.
I'll look next at how to estimate this value of the chance of success, which I'll just call P1.
Feel free to look at code below just to see how easy Yorick is (nice alternative to matlab). However, the user base is quite small so I would recommend using python if you're just starting. (I use Python for long code I share with others, yorick when I want to quickly program something.)
1:  func binom(p,n){
2:      /* DOCUMENT Compute the binomial prob for each
3:      *    element n with prob p
4:      */
5:      res=array(0., numberof(n));
6:      for(j = 1; j <= numberof(n); j++){
7:          for(i = 1; i<=n(j);i++){
8:              res(j) += p*(1-p)^(i-1);
9:          }
10:      }
11:      return res;
12:  }
13:  n = indgen(20);
14:  window,0;fma;
15:  plg,binom(.10,n);
16:  plg,binom(.33,n),color="red";
17:  plg,binom(.5,n),color="green";
18:  plg,binom(.75,n),color="blue";
19:  plg,binom(.8,n),color="magenta";
20:  pldj,n(1),.99,n(0),.99;
21:  lbl,,"n","P(n)";
